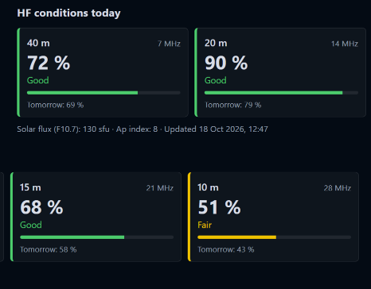
Voici une page de synthèse sur la propagation HF avec les prévisions pour les prochains jour et l’historique du passé.
J’ai choisi de ne pas afficher toutes les bandes habituelles pour ne pas surcharger le graphique.
Comme vous le verrez, il n’est pas difficile de se faire une idée.
Petit rappel sur la propagation en générale pour le DX :
40 m (7 MHz) : meilleure de la tombée de la nuit jusqu’à l’aube, avec un pic autour du lever et du coucher du soleil. En plein jour, elle ne donne que du court et moyen trajet.
20 m (14 MHz) : bande de jour, du lever du soleil jusqu’en soirée. Quand le flux solaire est élevé, elle reste ouverte tard le soir.
15 m (21 MHz) : de jour seulement, avec un maximum en milieu de journée et en début d’après-midi. Elle ne s’ouvre largement que si le flux est assez haut.
10 m (28 MHz) : de jour seulement comme le 15 m, mais plus courte et plus dépendante du flux. Elle s’ouvre surtout par intermittence.
Loading propagation data…
DX conditions today (long distance)
DX: hour by hour today ()
Hourly profile estimated from the daily index and the position of the sun: 40 m is best around night and twilight, 20 m by day, 15 m and 10 m mostly around midday. It is a rule of thumb, not a measurement.
DX: last 30 days and forecast
DX: five-year history
NVIS conditions (regional, up to about 500 km)
NVIS works when the frequency is below the critical frequency of the F2 layer (foF2) and above the absorption limit of the D layer. By day, 40 m and 60 m are usually the best; at night, 80 m and 160 m take over and 40 m often skips over nearby stations.
NVIS: today and tomorrow, hour by hour ()
NVIS values are estimated from the solar flux, the time of day and geomagnetic activity. They are not ionosonde measurements. Shaded areas are night. The 60 m band is not available to all amateurs in all countries.
The DX index (0–100 %) is an estimate of how open a band is for long-distance contacts, computed from the solar flux (F10.7) and geomagnetic activity. It is not a measurement: real conditions also depend on time of day, season and location.
Poor: below 33 % Fair: 33–65 % Good: 66 % and above
Data sources
Data: NOAA Space Weather Prediction Center (public JSON files). Cached on this site and refreshed up to four times a day.
- Monthly observed solar indices (5-year history): https://services.swpc.noaa.gov/json/solar-cycle/observed-solar-cycle-indices.json
- Predicted solar cycle (monthly, with high/low range): https://services.swpc.noaa.gov/json/solar-cycle/predicted-solar-cycle.json
- Observed 10.7 cm solar flux (last days): https://services.swpc.noaa.gov/json/f107_cm_flux.json
- Planetary K-index (last 7 days): https://services.swpc.noaa.gov/products/noaa-planetary-k-index.json
- 45-day forecast of F10.7 flux and Ap index: https://services.swpc.noaa.gov/json/45-day-forecast.json
Laisser un commentaire
Vous devez vous connecter pour publier un commentaire.